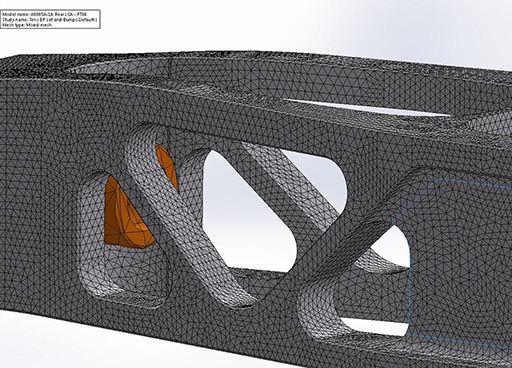
The final photo from the previous blog post was only finalized through extensive Finite Element Analysis (FEA). FEA uses a numerical, computer-based technique to solve complex scenarios. A variety of scenarios can be predicted, such as stress, heat transfer, vibration, fatigue, and other physical effects. The power of FEA lies in the ability to solve problems that would be extremely difficult or impossible to solve by hand. Similar to CFD, FEA partitions the structure into a finite number of elements. These elements form standard shapes, such as triangles, quadrilaterals, hexagons, etc. The use of these standard shapes allows the development of governing equations that can related stresses and displacement within the element. Please keep in mind that FEA is a tool, and in the wrong hands, it can be like shooting a target blindfolded. You need accurate inputs for accurate outputs.

For the LCA, we are interested in how the unit will react with the forces imposed on it by the vehicle’s acceleration, specifically the stresses that the unit will see. Stress is what will cause the part to fail and break. To test the LCA, we need to define quite a few parameters. Material needs to be defined, which is an aluminum that is significantly stronger than 6061-T6. We then need to constrain, think of it like fixturing, the LCA in a scenario indicative of how it resides on the car. Next up is loading the LCA with the data from our spreadsheet. There were four loads added, the load from lateral acceleration (1.7G), the load from bump acceleration (3.5G), the load from longitudinal acceleration (0.75G), and the load from the ARB (500 lbs). At this point, we can mesh and run the part.

The pink arrows show where the loads are being applied. This photo is showing the stress on the part in tension (inside rear wheel during a turn).
The two outputs we are interested in for this analysis are stress and deflection. We are specifically worried about the stress being above the yield point of the material. If this happens, the part will begin to fail. We set the maximum of the stress graph to the low end of yield strength, so if we saw any yellow or red, we are getting close to failure. The deflection was kept track of internally to look at from iteration to iteration; keeping deflection in check is good because when the part deflects, camber changes occur.

Stress graph of LCA in tension.

Deflection graph for the component in tension.
When we say tension, we are speaking about the lateral acceleration. If we think briefly about how the lateral acceleration affects the inside or the outside wheel, you will understand where we get tension and compression from. The inside wheel’s LCA is seeing a tensile lateral acceleration, while the outside wheel’s LCA is seeing a compressive load. The tensile load is less than that of the compressive load due to weight transfer while going around a corner.

LCA in compression stress graph. The same bump, longitudinal and ARB loads are applied.

Outside wheel's deflection.
This combined load proved to be the most difficult for the LCA to survive, but we did test multiple other scenarios. These other conditions tested were 2G braking, 5G lateral accel (light crash scenario), and 1.5G acceleration. These all proved to not stress the LCA much compared to the
FT-86 Lower Control Arm Development