A Look Inside Verus Engineering CFD - Validation

Comparing Results to a Professional Race Team
February 11, 2015 by
A Look Inside Verus Engineering CFD - Validation
Eric Hazen

We would like to give everyone a further, in-depth view of how we set up, run, and analyze our CFD cases here at Velox Motorsports.  While we will not be giving away exactly how to set-up and run the analysis, we hope to give you enough information to instill confidence in our methodology and results.  We decided there is no better way to show our skill set then on an analysis that allows us to validate our ability to provide accurate and reasonable data through CFD analysis.  To do this, we are using a known LMP1 model from Perrinn.  This CAD model is available for purchase online and has a multitude of data and published values for it as well.  If we set up and run the case correctly, we should be within a few percentages of this data.

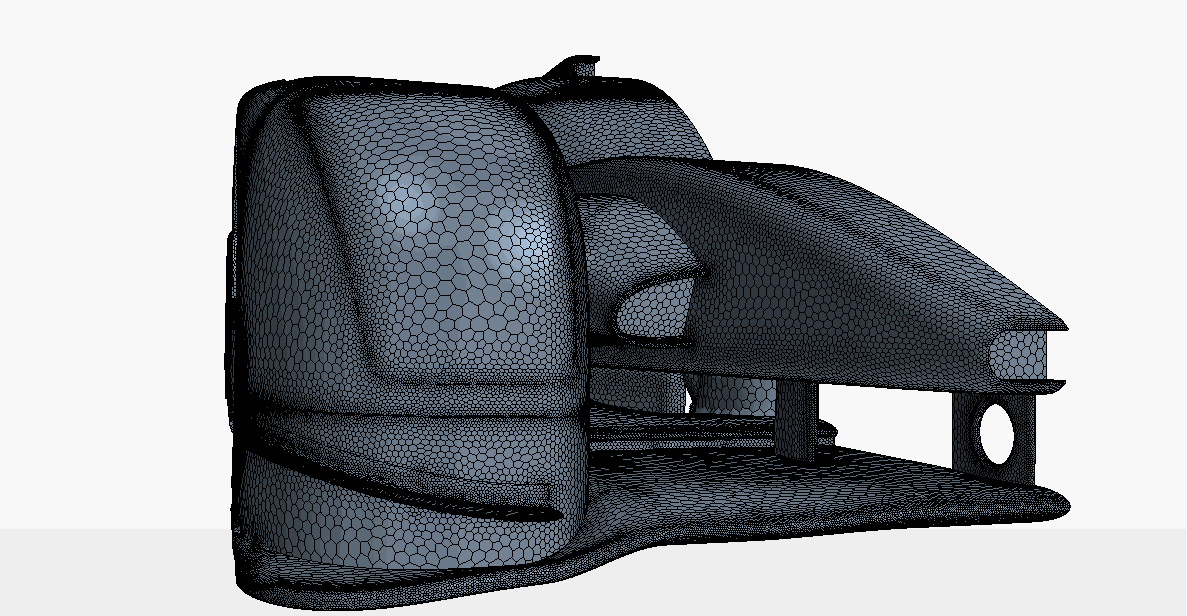
First, we start working with the CAD model.  Depending on the analysis and model, we can cut the car in half and solve the CFD analysis much quicker.  For cars that are symmetrical down the center-line and not being tested in yaw, this is a great way to reduce processing power and time.  Even with this technique, our analysis generally takes between 1 and 2 days to solve on a powerful desktop.  This LMP1 case study features a symmetrical vehicle being tested in a straight line scenario, so we will cut it in half along the Y-axis plane as shown below.

Verus Engineering Perrinn LMP1 Mesh

Next was placing the model into the CFD software and setting up the meshes.  This step is very important and can become extremely time-consuming.  When we have a new car that is being analyzed, we will run a mesh sensitivity study.  This allows us to size the mesh according to the desired accuracy we want to achieve (this is a simplified explanation but gets the point across).  To analyze the car, a wind tunnel will need to be created along with at least one wake refinement zone.
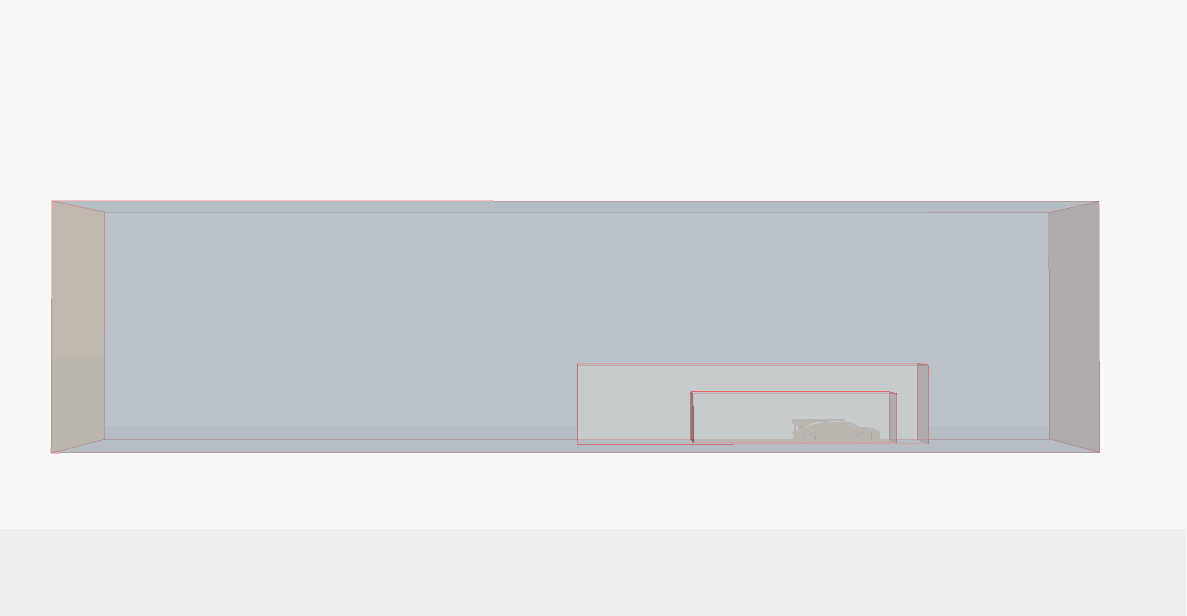
Verus Engineering Perrinn LMP1 Mesh

After the wind tunnel and refinement zones are nailed down, we begin setting up the vehicle’s surface mesh and volume mesh.  Creating a proper mesh is not an easy process and has a direct effect on the accuracy of the case.  If this is set-up incorrectly, results will not be accurate.
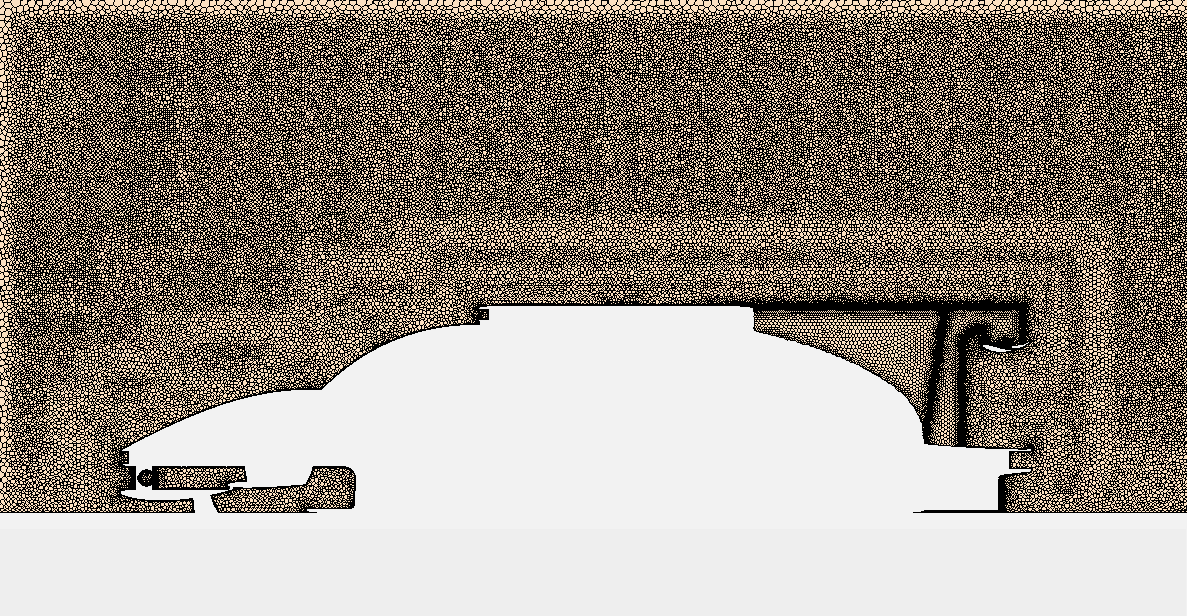
Verus Engineering Perrinn LMP1 Mesh

Next on the agenda is setting up the physics of the case.  Of the analysis, this is likely the most difficult part to get correct.  You have likely heard the phrase “the outputs are only as good as your inputs” and it certainly holds true here.  When we run the CFD case, the car is not actually moving, it is running similar to that of a rolling road wind tunnel.  We are flowing a fluid, air, over a stationary object, the LMP1 model.  To represent what happens in the real world, we set-up a rolling road.  This is the bottom surface of the wind tunnel and moves at the same rate as the inlet velocity.  To further represent a real-world situation, we set the wheels as rotating components, to that of the rolling road’s speed.  This is all in an effort to simulate as near to a real-world situation as possible.

To solve this, we used a steady-state solver with constant density.  Depending on the analysis, we use a few different turbulence models.  For this specific analysis, a realizable k-epsilon turbulence model was used.  More physics setup takes place in the analysis but we can’t divulge everything :).

Before running the case we must setup stopping criteria or the analysis would run indefinitely.  We generally watch for the coefficient of lift and the coefficient of drag to converge as our stopping criteria.  This analysis took just under 25 thousand iterations to converge these values.

Post-processing is the final step in an analysis.  We can now verify our numerical data with that from the other company, in this case, Perrinn.  We found that our analysis matched Perrinn’s graphs and values for their study, which we considered a success.  We could stop the analysis at this point as we were only comparing results. 

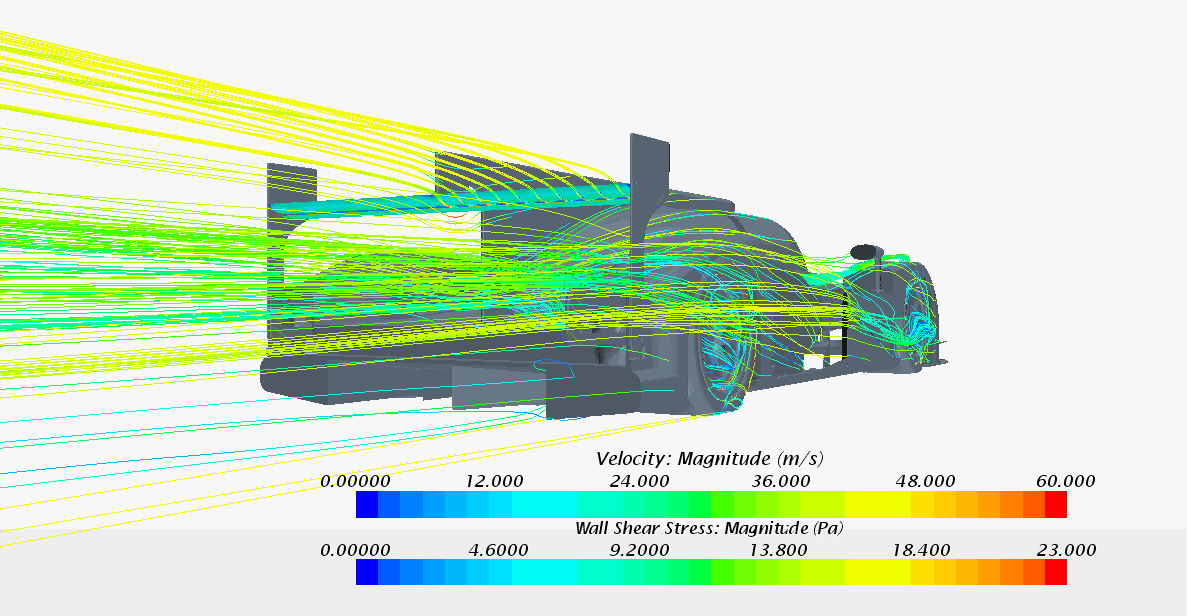
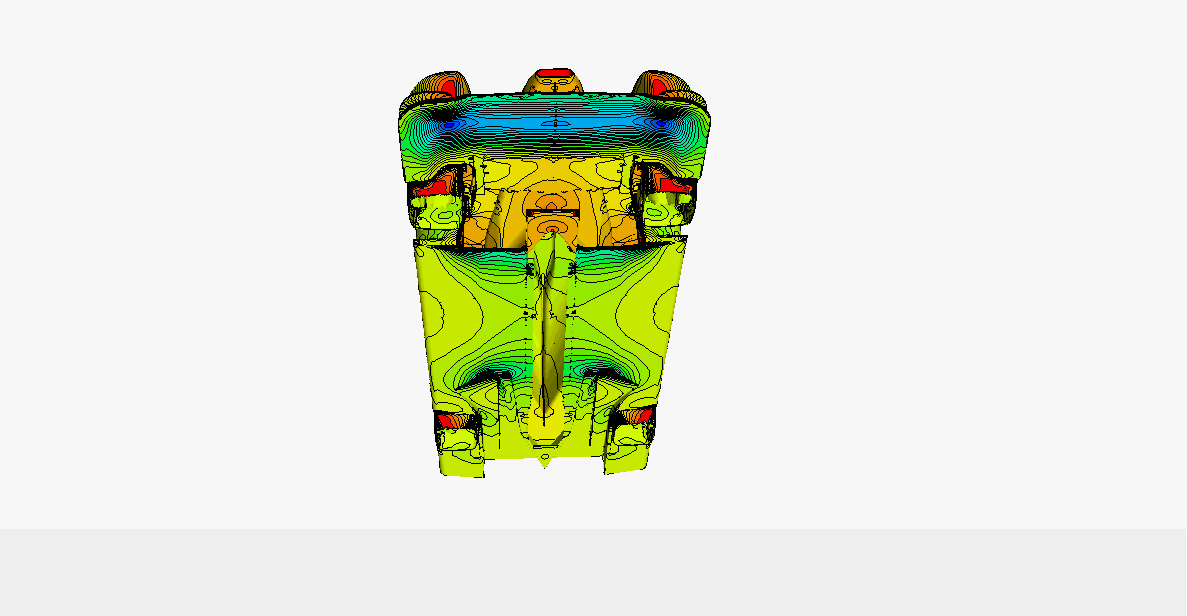
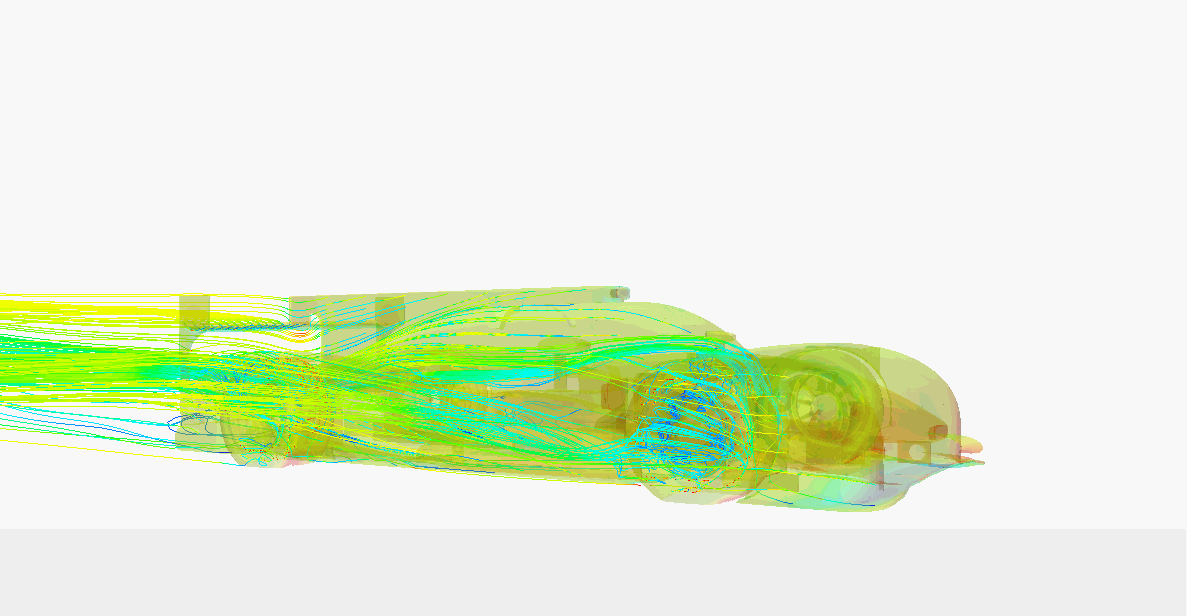
However, we are typically running analysis to see where we can make improvements for development.  We use both numerical data and post-processing videos, graphs, streamlines, pressure plots, and various photos for developing aerodynamic components.  These allow us to see where we can make improvements and how components are benefiting or hurting flow around the vehicle.  Below are some photos and views of what we would typically look at to see where we think we can make gains and improvements.
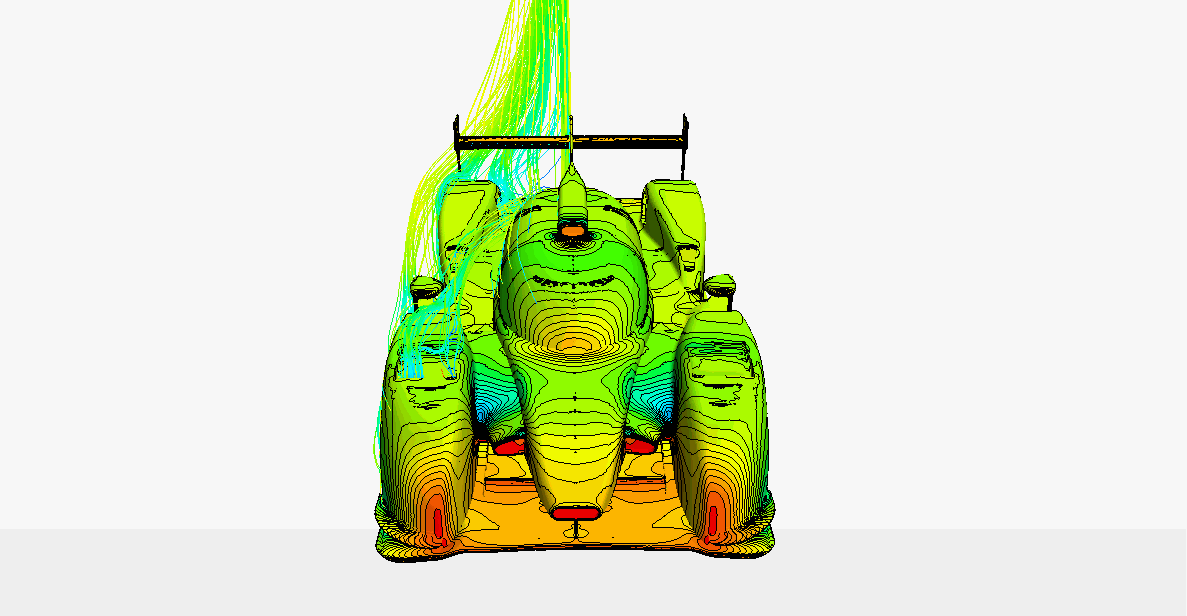
Verus Engineering Perrinn LMP1 CFD Analysis

Even though CFD looks simple, it is far from it.  A lot of times users become trigger happy and hit go on the CFD button well before he or she should.  To setup, run, and analyze a study, users must not only understand the software thoroughly but also have a firm grasp on fluid dynamics and aerodynamics.  Do not forget that basic hand calculations can verify if your answers are in the correct realm.  Before CFD programs surfaced, all aerodynamics was done through hand calculations. 

One Final Thought

A decent comparison for CFD software to something that is more readily spoken about on forums and in the aftermarket community would be dynamometers.  We have all heard or said that dynos can read anything the user wants it to base on the input settings.  The same is very true for CFD analysis.  That is why at Velox Motorsports, we do our personal best to accurately set up and run cases.  With the FR-S and BRZ analysis, taking the time to ensure that the analysis output data in line with published values from the manufacturers.  We then locked in all these inputs and ran any modification with the same inputs, so we are comparing apples to apples.

A Look Inside Verus Engineering CFD - Validation
Eric Hazen February 11, 2015
Share this post
Tags