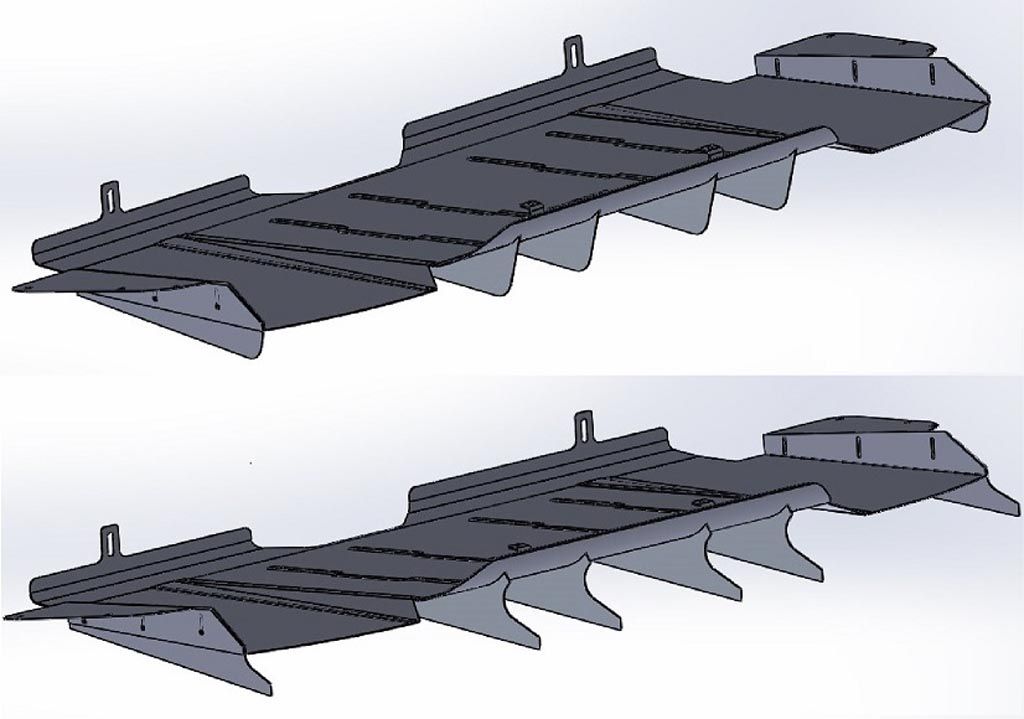
Purpose: This document contains diagrams, information, and notes regarding the design and CFD analysis of the SubiSpeed by Velox Motorsports rear diffuser kits.
Design: The rear diffuser was designed for those who want an extremely functional piece that dramatically reduces drag and increases downforce. We believe this to be the highest downforce producing unit on the market at this time. The aesthetic goal was to blend into the vehicle's exterior and integrate it as if an OEM piece. We used cutting-edge technologies to deliver the best fitting, best performing, and most integrated unit possible.
We started by laser scanning the entire underbody of a 2015 WRX STI. Using this scanned data in CAD, we are able to design a product that fits well, looks great, and performs with a purpose.
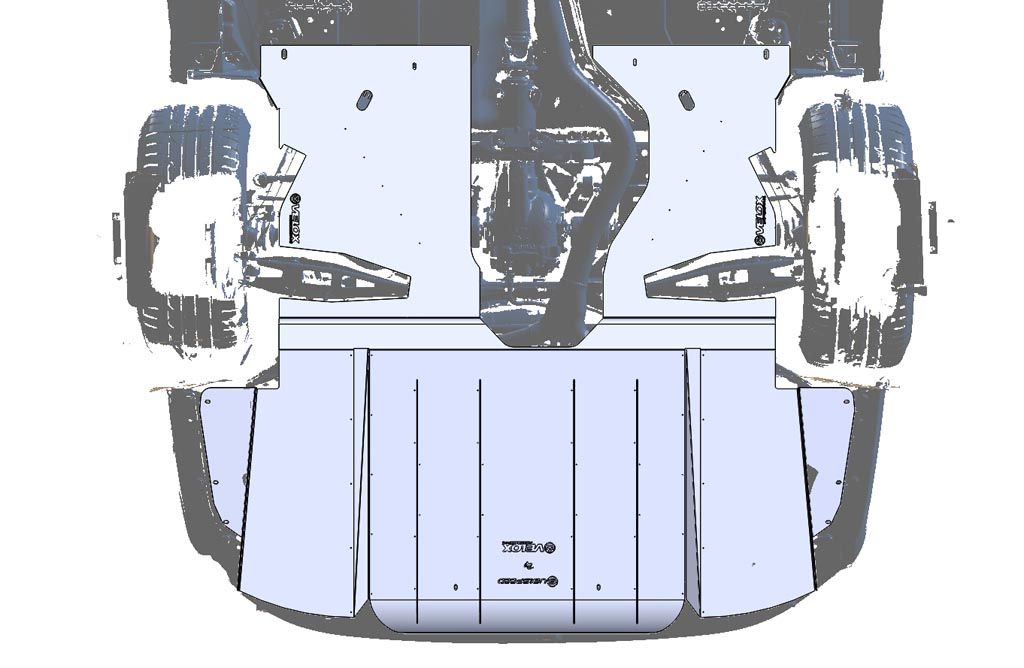
CFD Analysis
How do we know we are somewhere in the realm of potential results? We use past knowledge, compared results with published aero analysis (Perrinn LMP1 model, Ahmed model, and DrivAer models to name a few), and finally, we use published values for the WRX. We analyzed the stock body and compared this to the drag numbers published by Subaru; we were within a few percentages. For a CFD analysis, this is good and within the accuracy necessary to predict real-world performance. This analysis was performed at stock ride height.
The CFD post-processing offers both visualizations of the flow and numerical data. Using both of these we can make educated guesses as to the changes to make to optimize parts of the system to reach design goals. Surface pressure plots allow us to visualize the location of high and low pressure very easily and shows where and how the component is working.
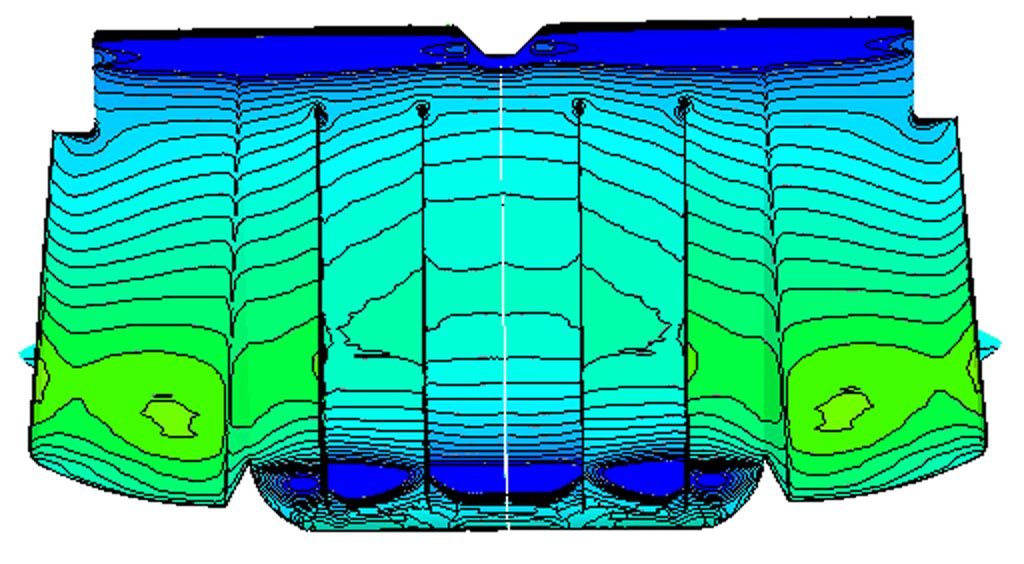
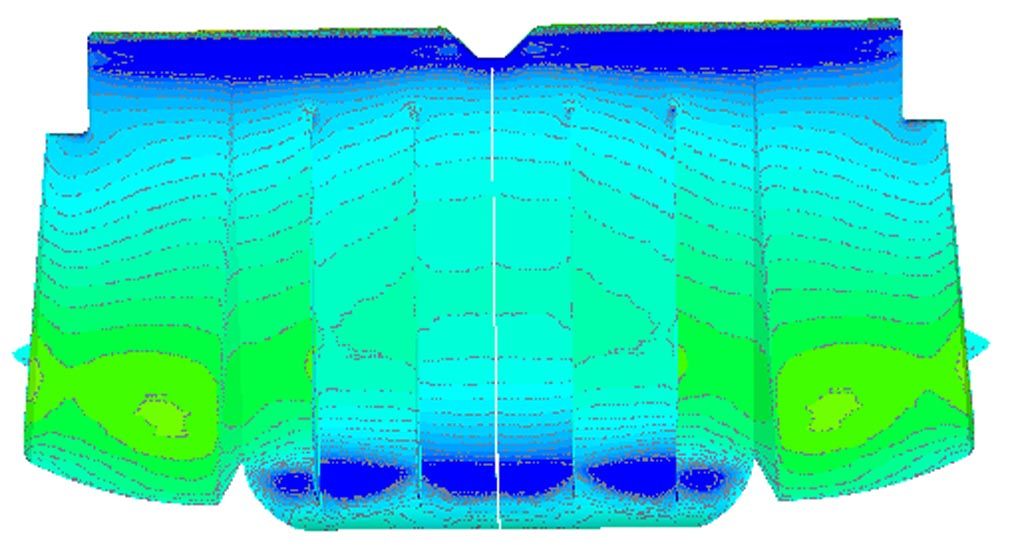
Rear Diffuser with Pressure Plot on Surface, With and Without Contour Lines
Air pressure plots allow us to see how the parts are influencing the air around the vehicle.
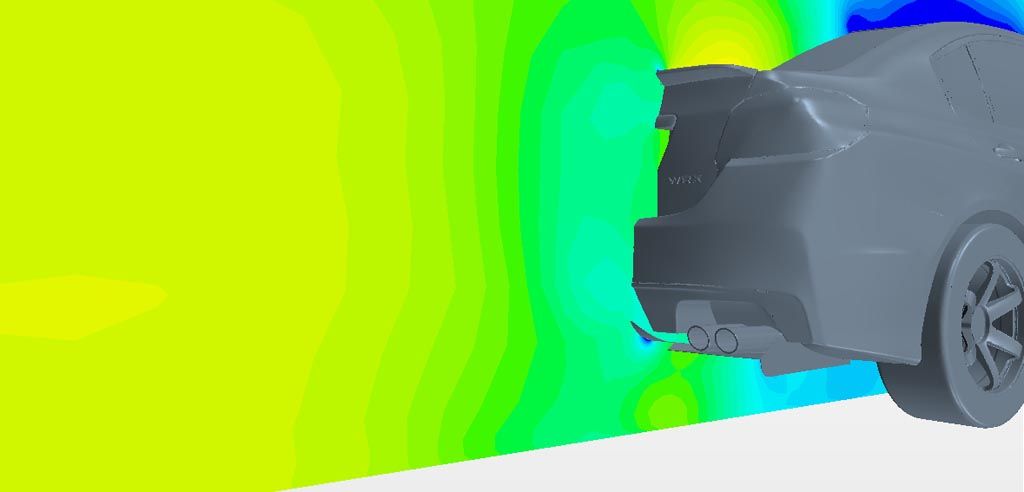
Air Pressure Plot of WRX Rear Diffuser
Another powerful visualization is air velocity.
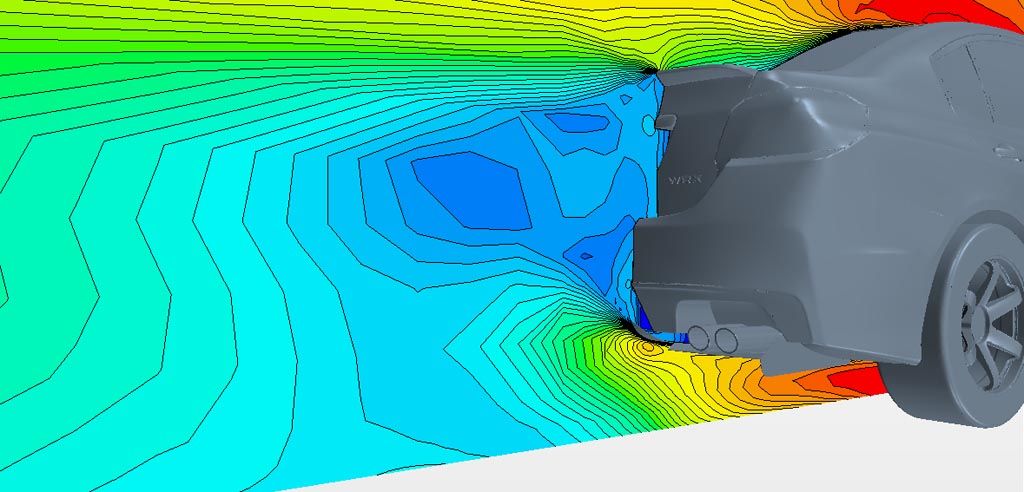
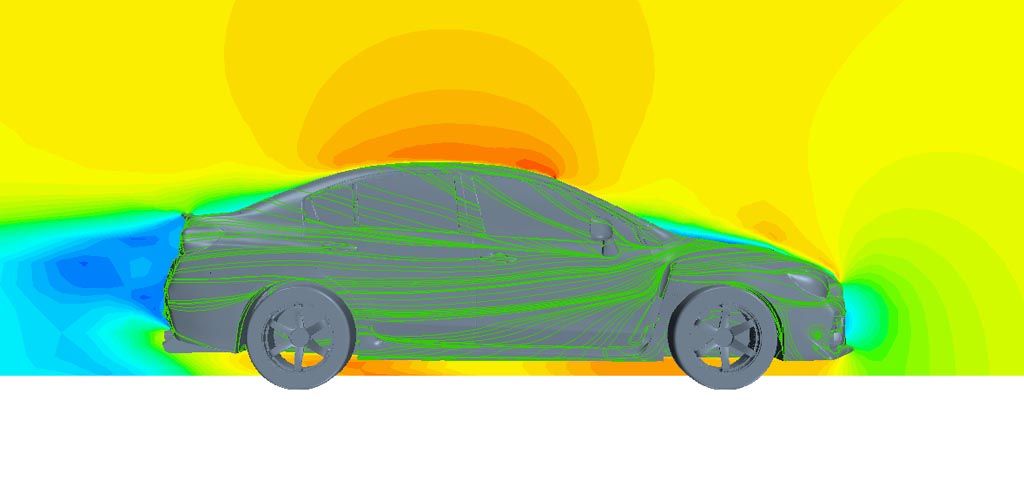
Air Velocity with Contour Lines and Air Velocity with Streamlines on Body
Another powerful tool CFD offers is surface streamlines.

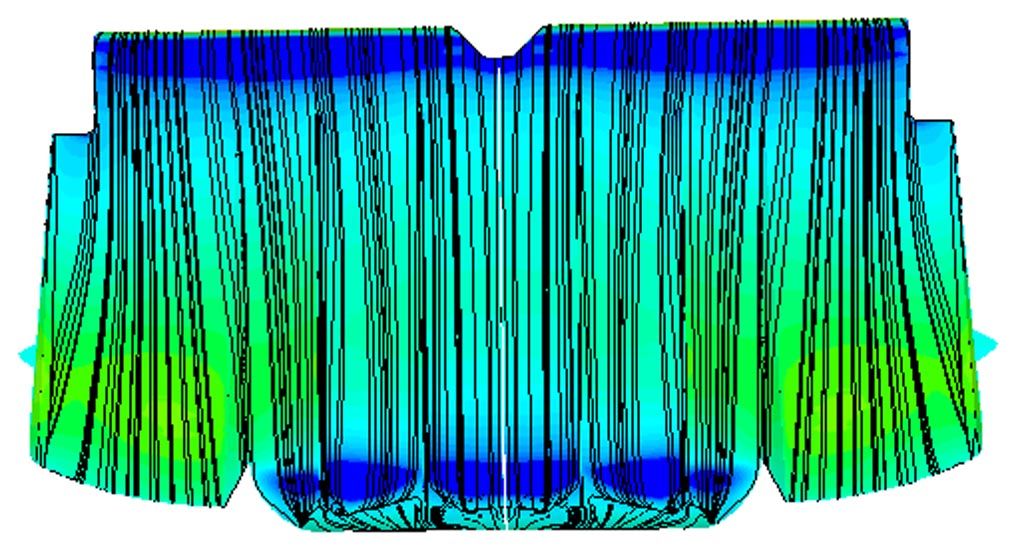
Surface Streamlines With and Without Pressure Plot on Diffuser
Finally, we get to vector plots with the CFD analysis, which allows us to view the magnitude and direction of air velocity.
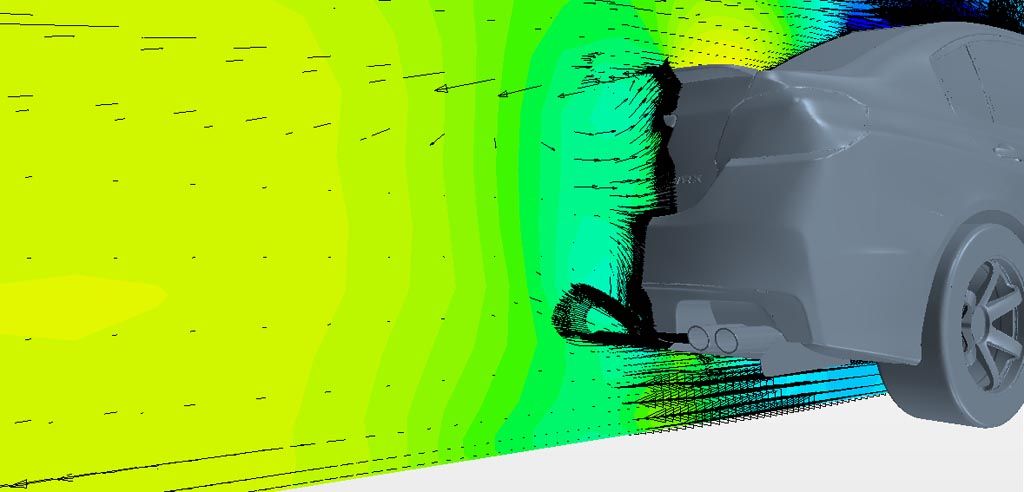
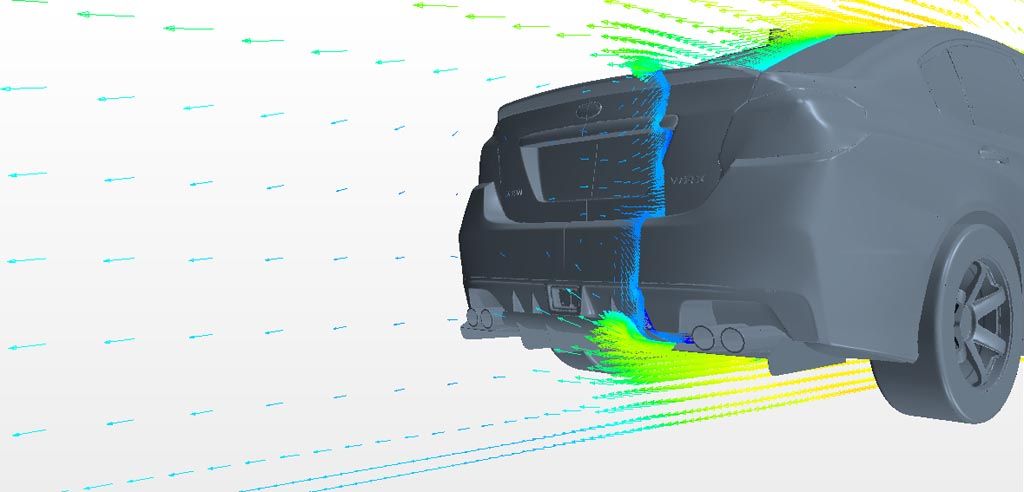
Air Pressure Plot with Vectors and Vector Arrows on Symmetry Cut Plane
One last view we wanted to look at was a before and after.
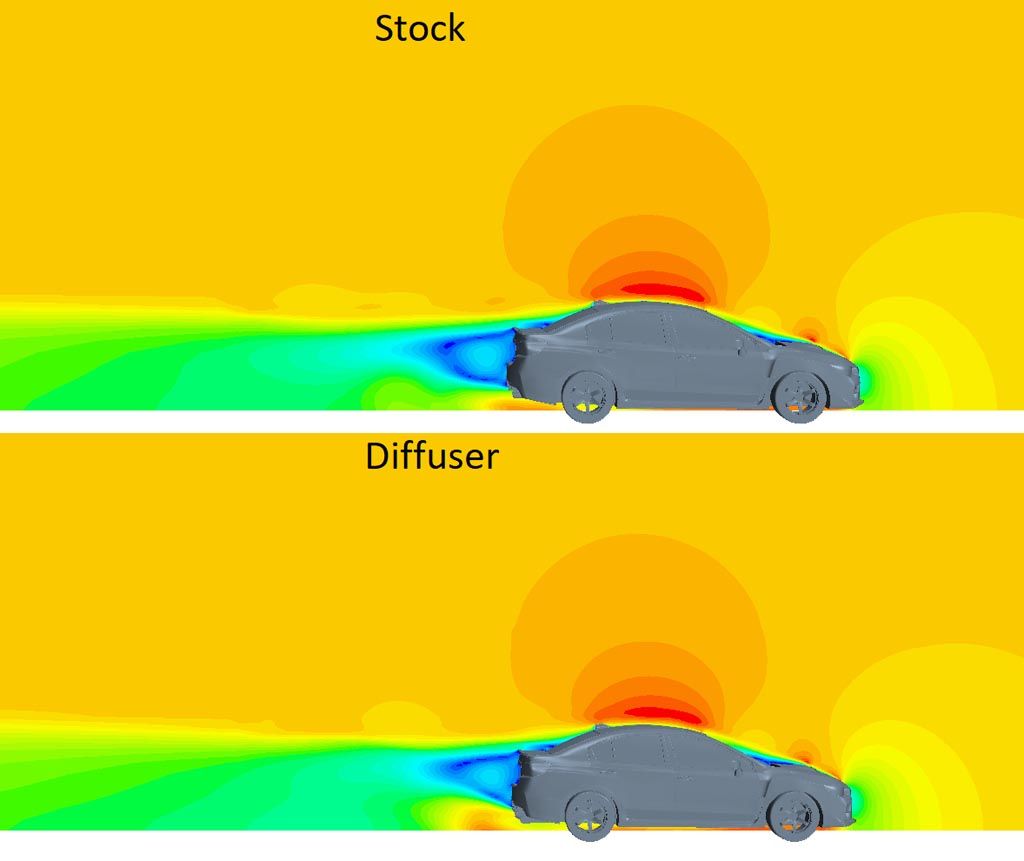
Comparison Plot, OEM is Top, Diffuser Added on Bottom
Data: The rear diffuser decreases lift dramatically and reduce drag quite a bit. It also shifts the aero balance rearward which is a good thing with a front weight biased vehicle. The lift coefficient decreased significantly but is not negative yet; which means the WRX is not creating downforce but is very close to.

Numerical Data from CFD Analysis
Conclusion: These results are logical to us and are reasonable gains in aerodynamic performance for a component of this nature. Most OEM cars produce lift in stock form, which our analysis backs up. This is the floating feeling you feel when reaching triple-digit speeds. A 4% reduction in the coefficient of drag is actually quite large for a product of this nature and an 81% reduction in
Real-world benefits may differ as this is a computational analysis that simulates real-world results. Simulations, both computer (CFD) and real-world (wind tunnel) generated, are inherently riddled with inaccuracies that can skew results. Something as simple as ride height or wheel choice can vary results, as well as various other aspects. Real-world results could be better or worse than what is shown above. We must remember though, given the model we started with, the above data is accurate and should translate to real-world benefits.
Very few companies perform CFD or wind tunnel analysis on any of their aerodynamic pieces. As a consumer, you can rest assured that you are receiving a quality component with an engineering analysis that has proven to benefit the vehicle's characteristics.
2015+ VA Chassis WRX Diffuser Analysis